
projectile motion in fortran | relation of angle of projection and horizontal range
Have you ever tried to visualize projectile motion in fortran program?
This post will help you to generate data and plot the graph of projectile motion.

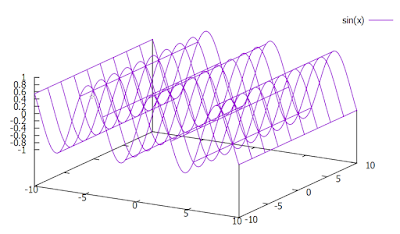
Above figure shows you the angle of projection(°) versus horizontal range (meter) plot, where the speed of projection is 30 m/s.
👉 Click on link for NEB grade 12 physics numerical problem-solutions:- LINK
Let's start with some basic things:
What is projectile and projectile motion ?
Projectile:
A projectile is an object thrown to the sky with certain velocity against the earth's gravity. The motion that the projectile possesses during it's journey until it returns to the same surface, from where it was thrown, is called the projectile motion.
In above figure, the projectile starts it's journey from point o and follows the curved path to reach another point on the same surface.
Suppose,
`\theta` = angle of projection
`\therefore` Angle of projection is the angle between the horizontal surface of earth and the direction to which the object is projected/thrown.
u = velocity of projection
`\therefore` Velocity of projection is the velocity given to the object when it is projected.
R = horizontal range
`\therefore` Horizontal range is horizontal distance from the point of projection of the projectile to point of landing on the same surface. In above figure, o is the point of projection.
Resolving u into two components `u cos\theta` along x-axis and `u sin \theta` along y-axis,
`u_x = u cos \theta`
`u_y = u sin \theta`
Then, relation between horizontal range and angle of projection is,
R = `\frac{u^2 \times sin(2\times \theta)}{g} ..........................(1)`
We use this relation to generate data of angle of projection and horizontal range.
Then these data will plotted to get the graph given as above.
You can also use this method to generate other set of data, such as angle of projection and vertical height, by changing the relation (1).
Maximum Vertical Height,
`H = \frac{u^2 \times sin^2 \theta){2g} .................... (2)`
Time of flight,
`T = \frac{2u sin \theta}{g} ...............................(3)`
You see all of R, H and T depend on angle of projection (`\theta`), because u and g are fixed.
Example:
Question: Write fortran code to find horizontal range of a projectile neglecting air resistance. Given values: take velocity of projection `u =30 \frac{m}{s}`, `g = 9.8 \frac{m}{s^2}`.
This code works for generating data of angle of projection (`\theta`) and horizontal range (R).
.......................................................
fortran program:
........................................................
program projectile_motion
implicit none
integer::angle,
real::theta
real,parameter::u=30.0, g=9.8, pi=4.0*atan(1.0)
open(1, file='projectile.dat', action='write')
do angle = 0,90
theta=angle*(pi/180.0)
R = (u**2*sin(2*theta))/g
write(1,*) angle, R !write data in file 'projectile.dat'
print*, angle, R !displays output
end do
close(1)
end program
.................................................................
After running this code, you have a file 'projectile.dat', open it and see the data. The first column contains angle in degree and second column contains corresponding values of horizontal range in meter.
................................................................
To plot this data, you can use any plotting software of your interest. I used
gnuplot software.
steps for plotting graph:
1. By right clicking on mouse, open terminal on same folder where the data file 'projectile.dat' is saved.
2. load gnuplot on terminal
3. load data file in gnuplot with commands given as below,
gnuplot> plot 'projectile.dat' u 1:2 w lw 3 lc 10 lt 8
4.press enter to see the graph.
You get graph as shown below.

You can apply similar method for maximum height(H) and time of flight(T).
........................................................
For more details, Watch Video
......................................................
........................................................
Thanks for the visit !
........................................................


Comments
Post a Comment