
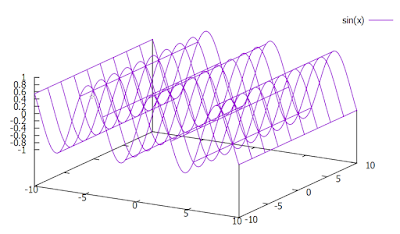
plot graph in gnuplot from csv and data file | knowledge of physics
If you are using LINUX based OS, for example Ubuntu, you must be familiar with plotting data in gnuplot saved in a file with .dat extension. It is very simple technique.
To plot data in .dat format, you simply go to gnuplot and run following command,
gnuplot> plot 'file_name.dat' using 1:2
This command gives you simple plot of your data saved in file_name.dat. You can further modify this plot by adding title, axes names, legends and colors of plot and width etc. Here 1:2 means first column of data is along x-axis and second column along y-axis.
But what about if you have data in a file of .csv format ?
Let's discuss.
CSV means coma separated variables. This means each column of the data in the .csv file is separated by coma (,), and gnuplot does not accept this format directly just as you do for the .dat file.
For gnuplot to read data from .csv file, you should tell it that data you are applying are in coma separated format. So, write code as below:
gnuplot > unset logscale x
gnuplot> set datafile separator ","
gnuplot> plot "book1.csv" u 1:2
Here first line says gnuplot to set that x axis data are not in log scale. It is optional.
second line tells gnuplot that data file is in csv format.
Third line tells gnuplot to plot the graph stored in data file named book1.csv by using column 1 in x-axis and column 2 in y-axis.
Code provided above plots only a simple graph. You can set title, xlabel, ylabel, legends etc. by watching video provided in the following link 👇.
Among three lines, second line code is optional.
watch full information of creating .csv file with excel and plotting graph from this file in gnuplot.
For more details, watch the video


Comments
Post a Comment