
how to plot 3D and parametric graphs in gnuplot | three dimensional plot in gnuplot software
Although being an open-source plotting software, gnuplot gives you almost all feasibilities to plot 2D, 3D, parametric plots and even the gif as well as animations.

Here you can learn to plot three dimensional graphs in gnuplot.
Additionally, you also get the idea of parametric plots in gnuplot software.
1. 3D graphs in gnuplot
To plot 3D graphs you just need to replace the command 'plot' for 2D graphs by 'splot' for 3D graphs.
Here, splot means surface plot.
Plotting graphs in 3D view allows you to observe it from all possible sides of the graph.
You rotate it upward, downward , left-side as well as to right-side.
Example:
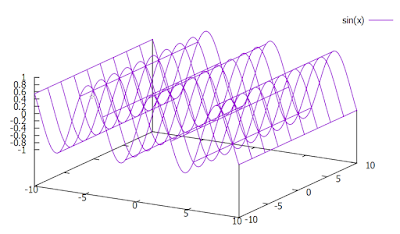
gnuplot > splot sin(x)
Then press ENTER key.
You get the output as it looks as picture below:

Fig. 1 3D graph of sin(x).
2. parametric plots
Parametric plots can be created both in 2D and 3D. For 2D graph, the dummy variable is t, whereas for 3D plot, they are u and v.
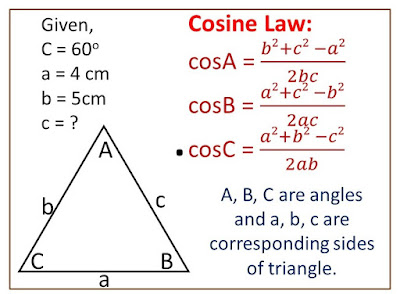
Example: Image of parametric plot is shown below:

Fig.2 Parametric plot of various functions
Get all the files created during video from link given in the button : Get Files


Comments
Post a Comment