
how to create GIF animation in gnuplot | animation using gnuplot software
GNUPLOT software is not only 2D and/or 3D plotting tool, but it also provides flexibility to create animation and GIF animation plots.
GIF means Graphics Interchange Format. It is a repeated display of images from same of different sides.
It helps you to view the image clearly so that you don't need to pay much attention to understand it.
This post provides you tools and techniques to create GIF animation in gnuplot.
Codes necessary for creating the GIF are given in links. Please check it as well.
GIF can also be both 2D and 3D. You must use 'plot' command to create 2D GIF and 'splot' command to create 3D GIF.
👉 To learn to create plots in gnuplot: Click Here
👉 To learn gnuplot basics for beginners: Click Here
Example of 2D GIF:

gnuplot > set title 'gif image of sine and cosine functions'
gnuplot > set xlabel 'x'
gnuplot > set ylabel 'sine and cosine'
gnuplot > f1(x,t) = sin(x-t)
gnuplot > f2(x,t) = cos(x-t)
gnuplot > set terminal gif animate delay 10 size 900, 800
gnuplot > set output 'sinewave.gif'
gnuplot > set xrange [-2*pi:2*pi]
gnuplot > set yrange [-1.5:1.5]
do for [i=1:96] {plot f1(x, i*0.1) title 'sin(x)', f2(x, i*0.1) title 'cos(x)'}
.................................................
To see the output, go to the FOLDER, where the newly created GIF 'sinewave.gif' is saved. Double click on this file and open it. If it does not open, then right on the file and follow the steps as follow:
sinewave.gif -> right click -> open with -> google chrome or any other browser.
...................................................
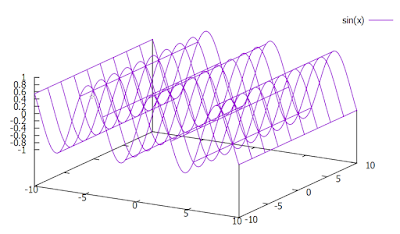
Example of 3D GIF:

Above GIF is a simple example of 3D GIF.
GNUPLOT Codes to create this GIF: 👇
gnuplot > unset border
gnuplot > unset ytics
gnuplot > unset xtics
gnuplot > unset ztics
gnuplot > unset key
gnuplot > f1(x,t) = sin(x-t)
gnuplot > f2(y,t) = tan(y-t)
gnuplot > f3(x,t) = cos(x-t)
gnuplot > set xrange[-2*pi:2*pi]
gnuplot > set yrange[0:pi/2]
gnuplot > set terminal gif animate delay 10 size 900, 800
gnuplot > set output 'gif1.gif'
gnuplot > do for [i=1:96]{splot f1(x, i*0.1) lc 7 lw 3, f2(y, i*2.5) lc 10 lw 3, f3(x, i*0.1) lc 5 lw 3}
Press ENTER to get the GIF plot.
.........................................................................
If you want to learn more in details, then follow the following steps.
...................................................
For more details: Watch Video
.........................................................
Download the code files from: Here
.....................................................
Thanks for the visit !
Please follow this page.
....................................................


Comments
Post a Comment